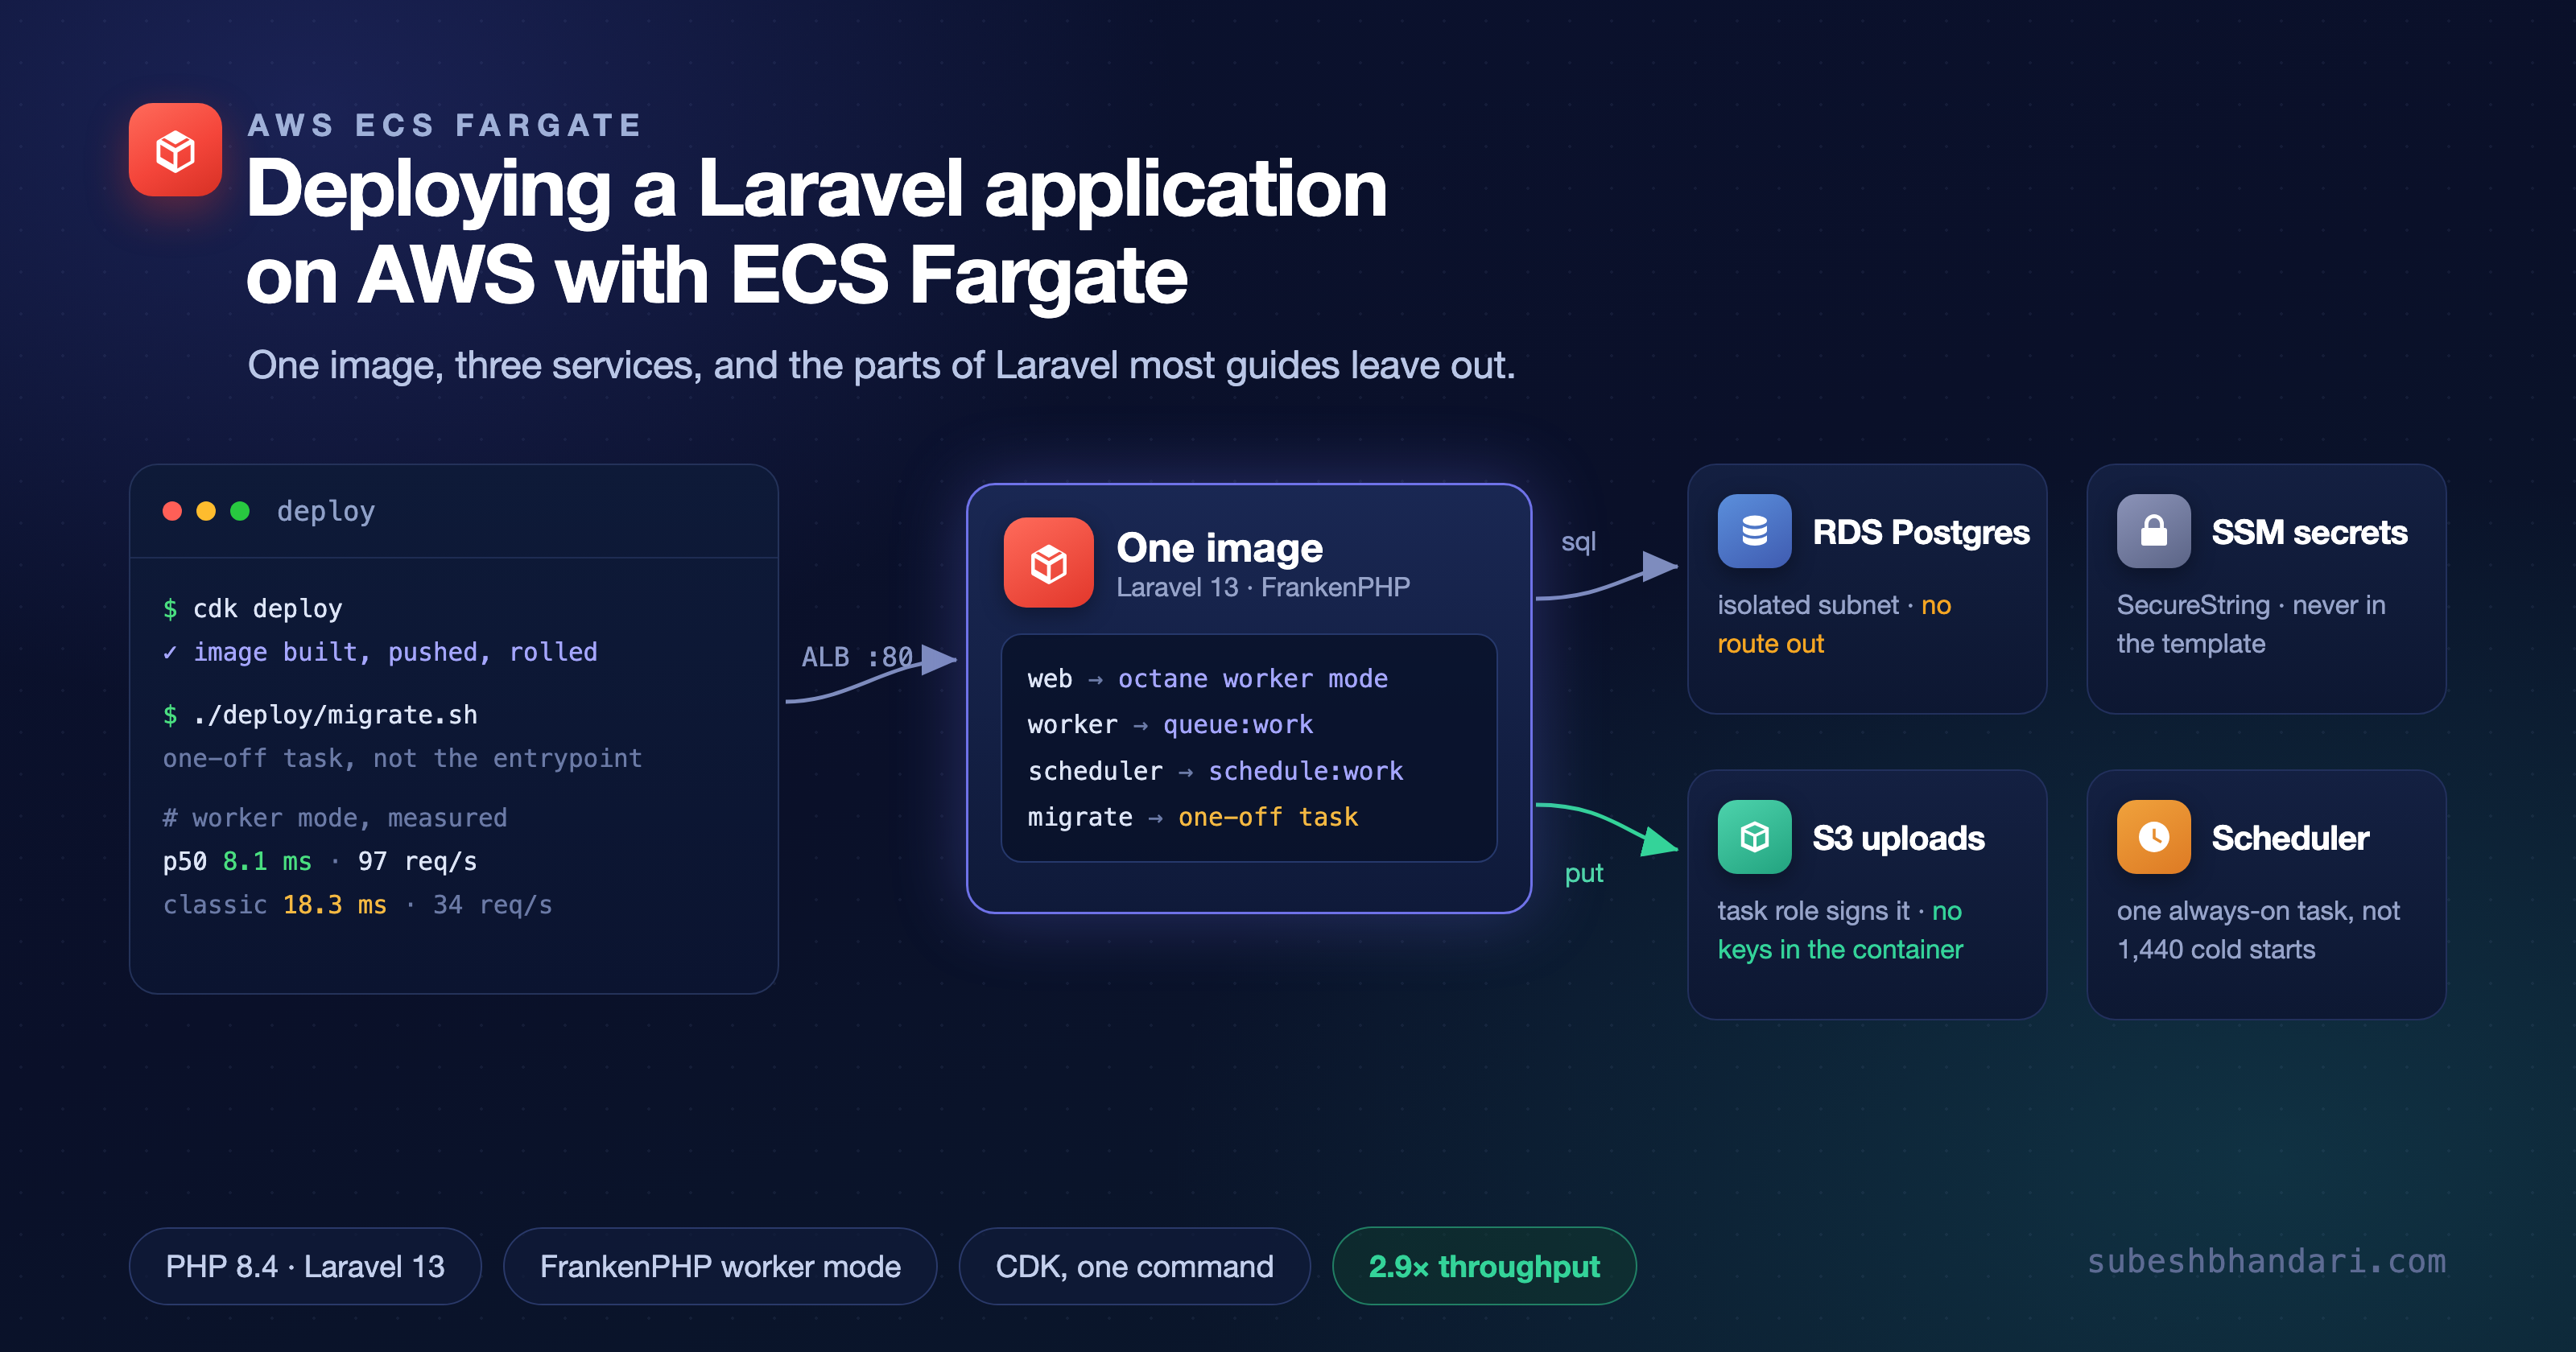
Most Laravel deployment guides stop at the point where a browser gets a 200 back. That is the easy quarter of the problem. A Laravel application in production is at least four things running at once: the web tier, a queue worker consuming jobs, a scheduler ticking every minute, and a migration step that has to happen at exactly the right moment in a deploy. Get the first one working and you have a demo. Get all four working, on infrastructure you can tear down and rebuild from code, and you have a deployment.
This is the whole thing on ECS Fargate: one container image, three long-running services, RDS PostgreSQL, S3, secrets in Parameter Store, all in a single CDK stack. I deployed it, hit it, measured it, broke it in two interesting ways, and then destroyed it. The code is at subeshb1/laravel-on-aws-fargate.
Two of the things I got wrong along the way are worth more than the parts that worked. One was a five-line Caddyfile that looked correct, passed every test, and silently threw away two thirds of the application's throughput. The other was a first deploy that rolled itself back because of an ordering problem every containerised Laravel app has and almost nobody mentions.
What runs
internet │ Application Load Balancer public subnets, 2 AZ │ :80 -> :8000 ▼ ┌───────────────────────┐ │ web service │ Fargate, 0.5 vCPU / 1 GB, 2 to 6 tasks │ FrankenPHP + Octane │ autoscaled on CPU └───────────────────────┘ ┌───────────────────────┐ │ worker service │ Fargate, 0.25 vCPU / 0.5 GB │ queue:work │ └───────────────────────┘ private subnets, NAT egress ┌───────────────────────┐ │ scheduler service │ Fargate, 0.25 vCPU / 0.5 GB │ schedule:work │ exactly one task, always └───────────────────────┘ │ ▼ RDS PostgreSQL 18 isolated subnets, no route out S3 bucket uploads and generated files SSM Parameter Store APP_KEY, database password
Three services, one image, one task role. They differ only in the command they run. That matters more than it sounds: the queue worker is running your application code, so it has the same dependencies, the same config cache and the same bugs as the web tier, and any deployment where those can drift apart will eventually bite you.
Versions, all current as of this week: Laravel 13.25, PHP 8.4.24, FrankenPHP 1.12.7 on Caddy 2.11.4, Octane 2.19, PostgreSQL 18.4, CDK 2.265.
The sample application is a status board
The app is small but it is not a hello world. Its home page makes one live call against every piece of the deployed architecture, so a green row is evidence that piece is actually wired up rather than merely present in the template.
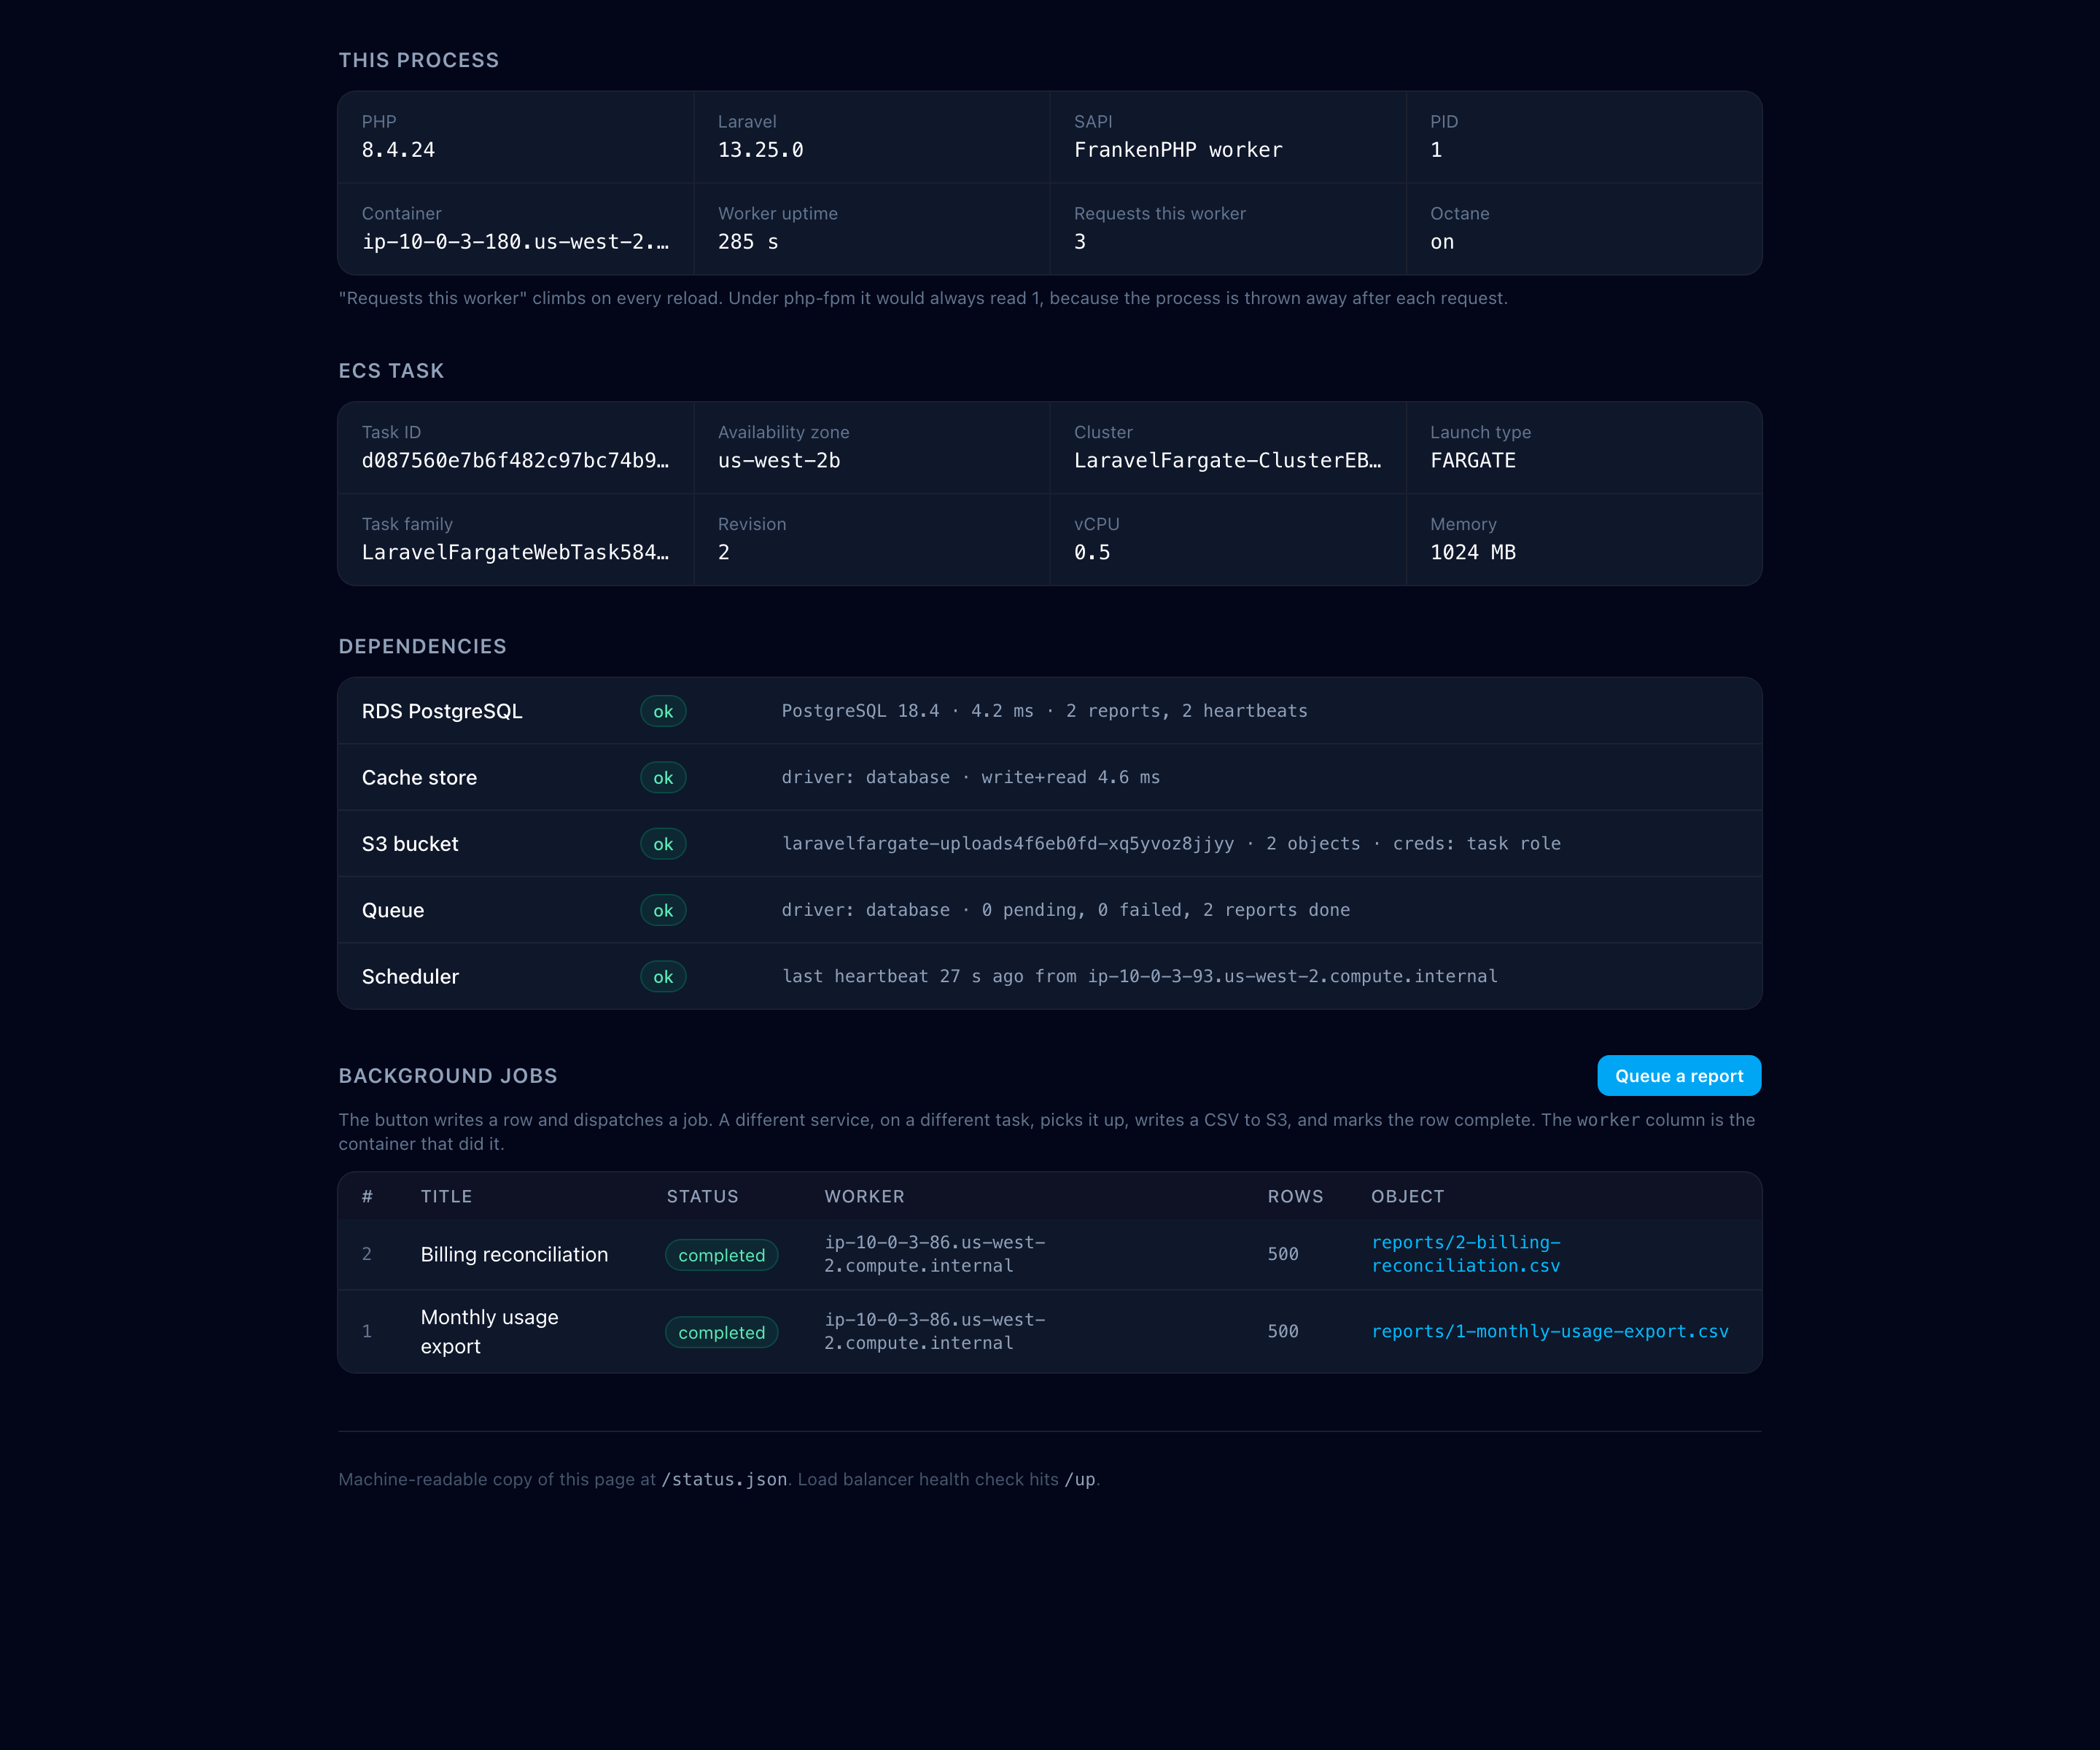
Look at the three hostnames on that page. The web tier is ip-10-0-3-180, the scheduler heartbeat came from ip-10-0-3-93, and both completed reports were written by ip-10-0-3-86. Three containers, three services, one image. That is the whole architecture visible in one screenshot.
The "Requests this worker" counter reads 3. Under php-fpm it would read 1 forever, because the process is destroyed after each request. It is a two-line instrument and it turned out to be the thing that caught my biggest mistake, which I will come back to.
Building the image
FrankenPHP is the right default for Laravel in 2026. It is a single binary containing both a Go web server and the PHP runtime, it has native worker mode, and it needs no separate process manager, no nginx, no php-fpm pool tuning, no supervisord. The whole "web server plus process manager plus PHP" tower collapses into one process.
Three stages, so the runtime image carries neither Composer nor Node:
dockerfileFROM composer:2 AS vendor WORKDIR /app COPY composer.json composer.lock ./ RUN composer install --no-dev --no-scripts --no-autoloader --prefer-dist --no-interaction COPY . . RUN composer dump-autoload --no-dev --optimize --classmap-authoritative FROM node:22-alpine AS assets WORKDIR /app COPY package.json package-lock.json ./ RUN npm ci --ignore-scripts COPY vite.config.js ./ COPY resources ./resources RUN npm run build FROM dunglas/frankenphp:1-php8.4-alpine AS runtime RUN install-php-extensions pdo_pgsql pcntl opcache intl zip bcmath \ && apk add --no-cache postgresql17-client WORKDIR /app COPY --from=vendor /app/vendor ./vendor COPY . . COPY --from=assets /app/public/build ./public/build
That produces a 306 MB image locally, 40 MB compressed in ECR. Full build from cold: 55 seconds on an M-series laptop building arm64 natively. Fargate on Graviton is about 20% cheaper per vCPU-hour than x86, and if your laptop is Apple silicon there is no emulation tax on the build either, so arm64 is close to free money.
Two details in the runtime stage earn their place.
opcache with revalidation off. Worker mode means the same PHP processes serve thousands of requests, so opcache should compile once and then never look at the filesystem again:
iniopcache.validate_timestamps=0 opcache.memory_consumption=192 opcache.max_accelerated_files=20000
validate_timestamps=0 is normally dangerous advice. Here it is safe for a specific reason: the application code cannot change inside an immutable container image, so there is nothing to revalidate. If you are bind-mounting code in development, do not copy this.
Caddy needs somewhere to write. FrankenPHP is Caddy underneath, and Caddy keeps state (certificate cache, autosaved config) under the XDG directories, which default to $HOME. The container runs as a non-root user whose home directory it does not own, so point those at /tmp before that becomes a startup failure you have to work backwards from:
dockerfileENV XDG_CONFIG_HOME=/tmp \ XDG_DATA_HOME=/tmp USER 10001:10001
The config cache belongs at runtime, not build time
php artisan config:cache freezes the value of every env() call into a PHP array. Run it in the Dockerfile and you bake in the build machine's environment: no database host, no bucket name, an empty APP_KEY. The application boots and then dies with No application encryption key has been specified, which sends you looking at your secrets configuration rather than at your build.
So it goes in the entrypoint, after ECS has injected the task definition's environment and secrets:
sh#!/bin/sh set -e php artisan config:cache php artisan route:cache php artisan view:cache exec "$@"
The cost is paid once per container start rather than once per request. Measured from docker run to a passing /up, including those three commands: 4 seconds on a 0.5 vCPU task, 5 on a quarter, 1 on a full vCPU. Worth knowing when you set the load balancer's health check grace period.
Note the exec. Without it, the shell stays alive as PID 1 and FrankenPHP becomes its child, which means the SIGTERM ECS sends at the start of a deploy goes to the shell and not to the server, and your tasks get killed at the end of the 30 second grace period instead of draining cleanly.
The Caddyfile mistake that costs 65% of your throughput
Laravel documents php artisan octane:start. That is the right command on a laptop: it supervises the server, restarts it when files change, and prints a friendly banner. In a container it is the wrong shape. ECS is already the supervisor, so octane:start adds a second PHP process whose only job is to watch the first one, plus a Caddy admin endpoint on port 2019 that nothing uses. Running FrankenPHP directly makes it PID 1 and lets SIGTERM reach it with nothing in between.
So the image runs frankenphp run --config /etc/frankenphp/Caddyfile, and the Caddyfile declares the worker:
caddyfile{ auto_https off admin off frankenphp { worker { file /app/public/frankenphp-worker.php num {$OCTANE_WORKERS:2} max_consecutive_failures 3 } } } :8000 { root /app/public encode zstd gzip php_server }
I deployed that. It worked. Every route returned the right thing, the health check passed, the logs were clean. Then I benchmarked it against classic mode as a sanity check and the two were identical: 18.1 ms p50 either way. That is not a plausible result for worker mode, and the reason was on the status page the whole time. "Requests this worker" was stuck at 1.
Declaring a worker is not enough. FrankenPHP hands a request to a worker only when the script it resolves to is the worker script. php_server resolves every request to index.php, which is not the worker, so each request booted the framework from scratch. The fix is two lines:
caddyfilephp_server { index frankenphp-worker.php try_files {path} frankenphp-worker.php }
Nothing errors without them. There is no warning in the log, no startup complaint, no degraded-mode notice. The only symptom is that the performance you installed Octane for never arrives. If you have added Octane to an application and been underwhelmed, this is the first thing to check, and the check is one line: expose a counter that increments on a static property and see whether it climbs.
With the two lines in place, on an identical 0.5 vCPU container against the same database:
| p50 latency | p90 | throughput at 20 concurrent | |
|---|---|---|---|
| Worker mode | 8.1 ms | 10.2 ms | 96.7 req/s |
| Classic mode | 18.3 ms | 21.9 ms | 33.8 req/s |
Latency halves and throughput nearly triples. The throughput gap is the more important number: at low concurrency you are waiting on the database either way, but under load the framework bootstrap is pure CPU competing with your actual work, and worker mode simply does not pay it.
One sizing rule worth knowing. FrankenPHP allocates one thread per worker plus one spare, so num 2 is three threads. I confirmed this across task sizes: num 1 gave 2 threads, num 2 gave 3, num 4 gave 5. Two workers on half a vCPU is a sensible starting point; raise it with the task size, not beyond it.
Three services from one image
The interesting part of the CDK stack is how little the three services differ.
tsconst defineTask = (name, cpu, memoryLimitMiB, command) => { const taskDefinition = new ecs.FargateTaskDefinition(this, `${name}Task`, { cpu, memoryLimitMiB, runtimePlatform: { cpuArchitecture: ecs.CpuArchitecture.ARM64, ... }, executionRole, taskRole, }); taskDefinition.addContainer('app', { image: ecs.ContainerImage.fromDockerImageAsset(image), command, // the only thing that varies environment, secrets, logging: ecs.LogDrivers.awsLogs({ streamPrefix: name.toLowerCase(), logGroup }), }); return { taskDefinition }; };
The web service gets no command override and runs the image's default. The other two override it.
The scheduler is a service, not a scheduled task. The instinct is an EventBridge rule launching an ECS task every minute to run schedule:run. Do not. That is 1,440 container starts a day, each paying 4 seconds of boot before it does any work, and it puts a minute of latency in front of every scheduled job. schedule:work is a long-running process that ticks internally, so it is one always-on 0.25 vCPU task, which costs about $7 a month and starts instantly.
Its desiredCount is 1 and it must stay 1. Two schedulers run every scheduled command twice. There is no coordination here, and Laravel's withoutOverlapping() protects against a slow job overlapping itself, not against two schedulers firing simultaneously.
The queue worker recycles itself. --max-time=3600 restarts the worker every hour:
ts'exec php artisan queue:work --tries=3 --max-time=3600 --sleep=1'
Long-lived PHP workers hold objects in memory across jobs, so a slow leak in one job class eventually takes the whole worker down. Recycling once an hour bounds the damage without anyone having to find the leak. ECS starts a replacement in seconds.
The first deploy rolled itself back
This one I hit for real, and it is worth showing the actual failure:
WorkerService99815FA9 Resource handler returned message: "Error occurred during operation 'ECS Deployment Circuit Breaker was triggered'."
CloudFormation creates the database and the services in the same deploy. The database comes up empty. php artisan queue:work starts, tries to read the jobs table, does not find it, and exits non-zero. ECS restarts it. It exits again. After enough failures the deployment circuit breaker fires and takes the whole stack down with it, including the web tier that was passing its health checks perfectly.
It is a genuine ordering problem, not a Laravel bug. The worker cannot start before migrations, migrations need a task definition, and the task definition does not exist until the stack deploys.
The fix is to make the containers that depend on the schema wait for it instead of assuming it:
tsconst worker = defineTask('Worker', 256, 512, [ 'sh', '-c', 'until php artisan migrate:status >/dev/null 2>&1; do ' + 'echo "waiting for migrations"; sleep 5; done; ' + 'exec php artisan queue:work --tries=3 --max-time=3600 --sleep=1', ]);
migrate:status fails while the migrations table is absent and succeeds once it exists. A container sitting in that loop is up and idle, which is exactly what it is, so ECS is happy, the stack completes, and the worker starts consuming the moment you run migrations.
Which brings up the obvious question: why not just run migrations from the entrypoint? Because in a rolling deploy of four tasks that races four migrations against each other, and because a failed migration then becomes a crash loop rather than a failed step you can read. Migrations are a one-off task:
bash./deploy/migrate.sh
php artisan migrate --force -> cluster LaravelFargate-Cluster... task acffa33555ac445e925a8c0a9eabf188 started, waiting for it to stop... --- container output --- INFO Preparing database. Creating migration table ................................ 15.41ms DONE INFO Running migrations. 0001_01_01_000000_create_users_table ..................... 18.23ms DONE 0001_01_01_000001_create_cache_table ...................... 9.06ms DONE 0001_01_01_000002_create_jobs_table ...................... 15.29ms DONE 2026_08_15_000001_create_reports_table .................... 5.43ms DONE 2026_08_15_000002_create_heartbeats_table ................. 4.43ms DONE --- exit code 0 ---
58 seconds wall clock, of which the migrations themselves were 68 milliseconds. The rest is Fargate cold start, which is the price of not having a bastion host.
Secrets, and the two roles
Two IAM roles, and the split is the part people collapse.
The execution role belongs to the ECS agent. It pulls the image, writes log streams, and decrypts the SSM parameters so it can inject them as environment variables. The task role belongs to your PHP process, and it is what the AWS SDK inside Laravel signs requests with. Application code never gets the execution role, which is why the status page can report creds: task role and why there is not a single AWS key anywhere in the container.
Secrets go in SSM Parameter Store as SecureStrings, not Secrets Manager. Standard parameters are free, Secrets Manager is $0.40 per secret per month, and neither APP_KEY nor a database password here needs rotation or cross-account sharing. Move the database password to Secrets Manager on the day you want automatic rotation, not before.
The database password has to reach CloudFormation at create time, which an ECS secret reference cannot do, so it goes in as a dynamic reference:
tsconst dbPassword = cdk.SecretValue.ssmSecure('/laravel-fargate/db-password');
CloudFormation resolves {{resolve:ssm-secure:...}} itself during the deploy. The value is never in the synthesized template, never in a stack event, and never in the CDK context file. The container gets both values through the task definition's secrets block, so they are also absent from docker inspect.
Two Laravel settings that are wrong by default behind a load balancer
Trusted proxies. Every request arrives from the ALB, so without this Laravel sees the load balancer's private IP as the client and generates http:// URLs behind an https:// listener:
php$middleware->trustProxies(at: '*', headers: Request::HEADER_X_FORWARDED_FOR | Request::HEADER_X_FORWARDED_HOST | Request::HEADER_X_FORWARDED_PORT | Request::HEADER_X_FORWARDED_PROTO | Request::HEADER_X_FORWARDED_AWS_ELB);
Trusting * is safe here precisely because the tasks have no public IP. The only route to port 8000 is through the ALB security group, so there is no path by which a client could forge those headers.
The S3 disk swallows errors. Laravel ships config/filesystems.php with 'throw' => false on the s3 disk. That means Storage::put() returns false on an AccessDenied instead of raising. A queued job that ignores the return value, which is most of them, then reports success while writing nothing.
I found this the direct way. Running locally with no AWS credentials, my report job printed DONE, marked the row completed, and wrote zero bytes:
2026-08-15 14:50:06 App\Jobs\GenerateReport ......... RUNNING 2026-08-15 14:50:11 App\Jobs\GenerateReport ......... 5s DONE
Turn it on:
php'throw' => true, 'report' => true,
A failed upload should fail the job so the queue can retry it.
Every shared driver has to actually be shared. CACHE_STORE, SESSION_DRIVER and QUEUE_CONNECTION all default to file, and file is wrong the moment there is more than one container: each task gets its own copy, so a user's session disappears the instant the load balancer sends them to a different task. This stack puts all three on the database. Postgres handles that fine at small scale, and Redis is the upgrade when queue throughput justifies it, not before.
Deploying it
bashexport AWS_REGION=us-west-2 ./deploy/bootstrap-secrets.sh # APP_KEY and DB password into SSM cd infra && npm install export CDK_DEFAULT_ACCOUNT=$(aws sts get-caller-identity --query Account --output text) export CDK_DEFAULT_REGION=$AWS_REGION export APP_RELEASE=$(git rev-parse --short HEAD) npx cdk deploy cd .. && ./deploy/migrate.sh
A cold create took 8 minutes 7 seconds end to end, most of it RDS. Redeploys after a code change are far quicker: CDK rebuilds the image, pushes it under a new content hash, and rolls the services with minHealthyPercent: 100, so new tasks pass their health check before old ones drain.
One thing to know before you start. I lost twenty minutes to this:
Vpc8378EB38 Resource handler returned message: "The maximum number of VPCs has been reached."
The default quota is 5 VPCs per region, and every cdk deploy that creates its own VPC consumes one. On a shared or long-lived account you hit that ceiling faster than you expect. Either request an increase, which is adjustable, or point the stack at an existing VPC.
Verification, from the deployed stack. First, /status.json immediately after migrations:
json{ "process": { "php": "8.4.24", "laravel": "13.25.0", "server": "FrankenPHP worker", "octane": true, "uptime_seconds": 228.7 }, "ecs": { "availability_zone": "us-west-2b", "launch_type": "FARGATE", "cpu_limit": 0.5, "memory_limit_mb": 1024, "revision": 2 }, "database": { "ok": true, "engine": "PostgreSQL 18.4", "latency_ms": 5.4, "reports": 0, "heartbeats": 1 }, "storage": { "ok": true, "objects": 0, "credentials": "task role" }, "queue": { "ok": true, "pending": 0, "completed_reports": 0 }, "scheduler":{ "ok": true, "age_seconds": 31, "source": "ip-10-0-3-93.us-west-2.compute.internal" } }
The scheduler is already alive, one minute after the schema appeared, and its heartbeat came from a different container than the one serving this request. Then two POST /reports over HTTP, and twenty seconds later:
json"queue": { "pending": 0, "failed": 0, "completed_reports": 2 } "storage": { "objects": 2, "credentials": "task role" } "database": { "reports": 2, "heartbeats": 2 }
Both jobs picked up by the worker service on its own task, both CSVs written to S3 with the task role, both rows marked complete. The screenshot above was taken at this point, and the worker column shows a third hostname again.
What it actually costs, and where the money goes
Latency measured at the load balancer, not from my laptop, because I am in Sydney and the stack is in Oregon:
| Route | Work done | p50 | p90 | p99 |
|---|---|---|---|---|
/up | framework only | 3.3 ms | 3.9 ms | 5.2 ms |
/ | 4 database queries plus a live S3 list | 106 ms | 194 ms | 393 ms |
600 samples for the first, 300 for the second. The gap is entirely the S3 ListObjectsV2 the status page makes on every load. That is a deliberately silly thing to do on a page render, and it is a useful reminder of the shape of these numbers: your framework is not your latency, your dependencies are.
Monthly cost, computed from the us-west-2 rate card (I pulled the figures from the AWS Pricing API rather than from memory):
| Item | Monthly |
|---|---|
| NAT gateway | $32.85 |
| Application Load Balancer | $16.43 |
| Fargate, 2 web tasks | $28.84 |
| Fargate, worker plus scheduler | $14.42 |
| RDS db.t4g.micro, 20 GB gp3 | $13.98 |
| Total, before data transfer | $106.52 |
The two most expensive line items are the NAT gateway and the load balancer, and neither of them runs any of your code. That is the thing to notice. If the tasks have no reason to reach the public internet other than pulling images and calling AWS APIs, VPC endpoints for ECR, S3, CloudWatch Logs and SSM remove most of the NAT bill. And the compute for the entire application, web plus worker plus scheduler, is $43 a month.
Cleaning up
bash./deploy/destroy.sh
It empties the S3 bucket first, because the stack deliberately does not create the auto-delete Lambda that CDK would otherwise add, then destroys the stack, deletes the two SSM parameters, and prints what is left:
ECS clusters: 0 RDS instances: 0 Load balancers: 0 NAT gateways: 0
Run that. The NAT gateway and the RDS instance are the two things you very much do not want to leave running by accident, and between them they are two thirds of the bill.
Where this stops being enough
Everything above is a single-tenant deployment. The moment the application has customers whose data must not touch each other, the interesting problem moves from "does it run" to "can tenant A read tenant B", and none of the infrastructure here answers that. The next post is about the answer: pushing tenant isolation into IAM session tags and PostgreSQL row-level security so that a forgotten where('tenant_id', ...) returns nothing instead of returning everything.
The complete project, including the CDK stack, the Dockerfile, the Caddyfile and the deploy scripts, is at github.com/subeshb1/laravel-on-aws-fargate. If you are moving a Laravel application onto AWS and want a hand, get in touch.
Subesh Bhandari
Engineer · Writer · Builder
Join the conversation
Comments are powered by GitHub.